Twitter Analytics provides a wealth of data about your account performance, but most users either ignore it completely or spend time tracking metrics that do not actually predict growth. Learning which metrics correlate with follower acquisition, which predict declining reach, and how to use data to make content decisions is one of the highest-leverage skills you can develop for growing your X presence. This guide focuses exclusively on the analytics that matter and shows you how to act on what they tell you.
The Leading vs Lagging Indicators Problem
Most analytics dashboards show you lagging indicators: what already happened. Follower count, total impressions, and total engagements tell you how you have performed. Leading indicators predict what will happen: they signal whether your account is on a growth trajectory or a plateau. Focusing primarily on leading indicators enables proactive strategy adjustment rather than reactive response to already-occurred problems.
The Most Important Leading Indicator: Profile Visit to Follow Rate
Of all the metrics available in X Analytics, the ratio of profile visits to new followers is the strongest leading indicator of growth momentum. If 1,000 people visit your profile this week and 50 follow you, that is a 5 percent conversion rate. If the same 1,000 people visit and only 10 follow, that is a 1 percent conversion rate. The profile visit volume is driven by content reach; the conversion rate is driven by how compelling your profile and content catalog appear to first-time visitors. Improving the conversion rate compounds growth without requiring more reach.
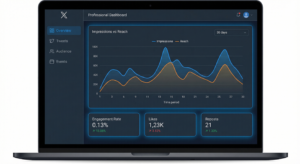
Interpreting Impression Data
Organic vs Promoted Impressions
X Analytics separates organic impressions (your tweets shown in timelines naturally) from promoted impressions (paid ad views). For organic growth strategy, focus exclusively on organic impression data. A tweet with 100K organic impressions performed well. A tweet with 90K promoted and 10K organic performed poorly organically but was artificially amplified by ad spend.
Impression Sources: The Key Insight
X Analytics shows where your impressions come from: home timeline (followers who saw it in their feed), search (users who found it through search), profile (users browsing your profile), and “other” which includes algorithm-driven distribution beyond your followers. The ratio of home timeline to “other” impressions tells you whether your content is primarily reaching your existing followers or being distributed beyond them. High “other” percentages indicate strong algorithmic amplification, which is what drives follower growth.
Key Metrics: Tracking and Benchmarks
| Metric | Good Benchmark | Red Flag | What It Indicates |
|---|---|---|---|
| Engagement Rate | 1-3% | Below 0.5% | Content resonance |
| Profile Visit / Follow Rate | 3-8% | Below 1% | Profile conversion quality |
| Link Click Rate | 0.5-2% | Below 0.2% | Content-to-action drive |
| Repost Rate | 0.3-1% | Below 0.1% | Content shareability |
| Reply Rate | 0.2-0.8% | Below 0.05% | Conversation sparking ability |
| 28-Day Follower Growth | 0.5-3% | Below 0.1% | Overall account momentum |
Content Performance Analysis
Monthly Top Tweet Audit
X Analytics’s “Top Tweets” view shows your highest-impression content for any selected period. Monthly review of your top 10 posts reveals content patterns worth replicating: which formats generated the most impressions, which topics resonated most, which post timing delivered the best performance. This data replaces guesswork with evidence for your content strategy decisions.
Identifying Content That Drives Follows vs Engagements
Not all high-performing content drives follower growth. Some content generates high engagement from existing followers without reaching new people. Other content reaches new people (high impressions, high profile visits) but does not convert them to followers. Tracking which specific posts correlate with follower growth spikes in the analytics timeline helps you identify the content type that performs both functions: reaching new audiences and converting them.
Audience Analytics
X Analytics provides demographic data about your followers: interests, consumer habits, and behavioral categories. Comparing your follower demographics to your target audience demographics reveals alignment or gaps. If you want to reach marketing professionals but your follower base skews toward students and job seekers, your content is not reaching your target audience despite potentially good engagement metrics from the audience you are reaching. Use audience demographic data quarterly to calibrate whether your content strategy is building the right audience.
Frequently Asked Questions
How do I access detailed Twitter/X Analytics?
Twitter Analytics is available at analytics.twitter.com for any account that has been active for at least 14 days. From the X app, access Analytics through the “More” menu on desktop. Analytics data is available for the past 28 days in the overview and for longer periods in individual tweet data.
How often should I review my Twitter analytics?
Weekly reviews of key metrics (impressions, profile visits, follower change) and monthly deep dives into content performance patterns is the recommended cadence for growth-focused accounts. Daily checking creates anxiety about normal fluctuations without providing actionable data.
What should I do if my impressions are declining?
Declining impressions typically indicate one of three issues: posting frequency has decreased, content quality or relevance has declined, or the algorithm has deprioritized your content type. Review your posting consistency, look at whether your recent content matches what performed best historically, and check whether your engagement rate has also declined (which would suggest a content quality issue).
Conclusion
Twitter/X analytics is most valuable when it changes your behavior rather than simply satisfying curiosity. The metrics outlined here, when reviewed consistently and acted upon honestly, create a feedback loop that steadily improves content quality, reach, and follower growth. Build the weekly review habit, focus on leading indicators over vanity metrics, and let the data guide your strategy evolution. Accounts that use analytics actively consistently outperform those that post on instinct alone.