
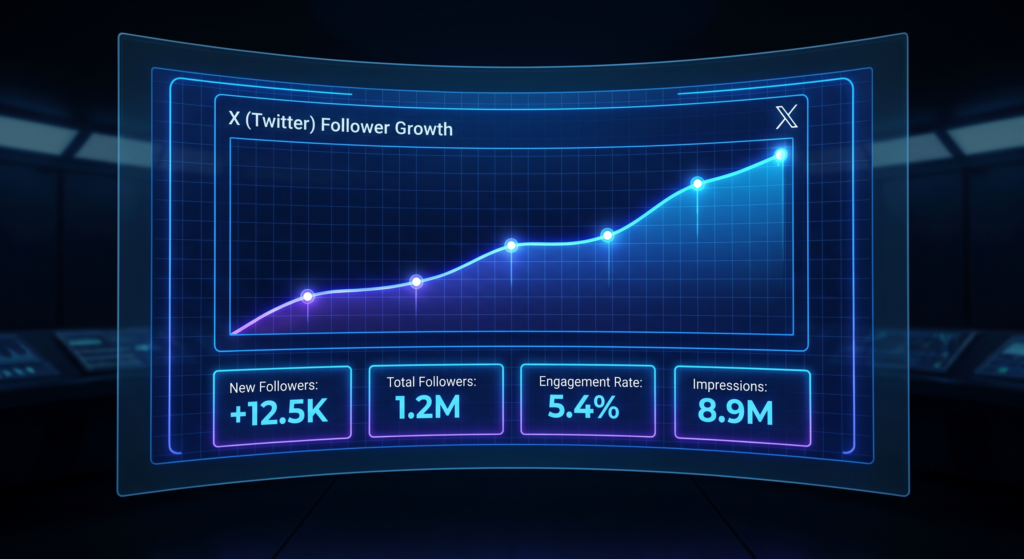
Your follower count is the first metric most people look at — and ironically, one of the least useful on its own. The number means nothing without context: are you gaining the right followers? Are they staying? Do they match your target audience? Twitter/X follower analytics, when used properly, answer these questions and provide a strategic roadmap for sustainable growth. This guide walks through every layer of follower data available on X in 2026 and how to translate it into real action.
Why Follower Analytics Matter More Than the Count
An account with 10,000 engaged followers in a specific niche will consistently outperform an account with 100,000 passive followers in virtually every business metric: conversion rates, click-through rates, brand partnership rates, and revenue from subscriptions or products. The quality of your follower base matters more than its size, and follower analytics are the tool for assessing that quality.
Follower Quality vs. Quantity
High-quality followers engage with your content, share it, reply to it, and take action on your calls to action. Low-quality followers — inactive accounts, bots, misaligned audiences — inflate your count without delivering value. Analytics help you distinguish between the two and optimize your content and growth strategy accordingly.
The Follower-to-Engagement Ratio
One of the most diagnostic ratios in social media analytics is the follower-to-engagement ratio. If your engagement rate is declining as your follower count grows, you may be attracting followers who don’t align with your content. If engagement rate holds steady or improves as you grow, you’re attracting the right audience through the right content.
Native X Analytics: What Follower Data Is Available
X provides several follower-related data points through its native analytics dashboard, accessible at analytics.twitter.com for Premium subscribers.
Follower Growth Over Time
The native dashboard shows your follower count trend over 28-day periods and longer historical windows. Look for patterns: which content periods correspond with growth spikes? Which months show plateau or decline? Spikes often align with viral posts, media mentions, or new content formats. Plateaus often indicate content fatigue or niche saturation.
Follower Demographics
X Analytics provides aggregated demographic data including geographic distribution (top countries and cities), language breakdown, and — in the Premium data dashboard — interest categories of your followers. These demographics should inform your content calendar, posting time strategy, and language choices.
Top Follower Interactions
X Premium shows which of your followers have highest influence scores and how often they engage with your content. These “super followers” deserve extra attention — replying to their comments, amplifying their content, and building direct relationships with them creates a loyal core that amplifies your reach exponentially.
Third-Party Tools for Advanced Follower Analytics
Native analytics have real limitations. Third-party platforms offer deeper insight into follower health, growth attribution, and competitive benchmarking.
Follower Audit and Bot Detection
Tools like SparkToro, Audiense, and specialized follower audit platforms analyze your follower list for quality signals: account age, posting frequency, profile completeness, follower-to-following ratios. A follower audit can reveal whether your growth has been organic and genuine or inflated by low-quality accounts — valuable information when pitching brand partnerships or evaluating growth tactics.
Growth Attribution Analysis
Understanding which specific posts or campaigns drove follower spikes requires correlating your posting calendar with follower growth data. Most premium analytics tools allow you to overlay content performance data with follower growth curves, making attribution analysis much more precise than native tools allow.
Audience Overlap Analysis
Some platforms provide audience overlap data — showing how much your follower base overlaps with competitor accounts or influencers in your niche. This is powerful for partnership identification: accounts with large audiences and low overlap with yours are ideal collaboration targets, as partnerships expose you to new audiences rather than reaching people who already follow you.
Interpreting Follower Growth Patterns
Raw follower numbers become strategic intelligence when you understand what different patterns indicate.
Consistent Organic Growth
Steady, consistent follower growth — 0.5–2% per month without major external catalysts — indicates that your content is consistently valuable and that new people are discovering it through search, shares, and algorithm distribution. This is the healthiest growth pattern and is most sustainable long-term.
Spike-and-Plateau Patterns
Viral content often produces dramatic short-term growth followed by a plateau or even decline as new followers decide the content isn’t regularly relevant to them. If your growth pattern looks like a staircase — spike, plateau, spike, plateau — analyze what drove each spike and evaluate whether those audience segments are sticking around and engaging.
Slow Decline
A gradual follower decline (more unfollows than new follows) indicates content drift or audience misalignment. You may have changed your content focus, posting frequency, or tone in ways that alienated your existing audience. Analytics can help pinpoint when the decline began and correlate it with specific content changes.
Using Follower Data to Inform Your Content Strategy
The entire point of collecting follower analytics is to make better decisions. Here’s how to close the loop between data and action.
Posting Time Optimization
Your follower geographic distribution directly informs optimal posting times. If 60% of your audience is in the US Eastern time zone, your 9 AM post targets them during their morning scroll. If 40% are in the UK, a 2 PM post catches them after lunch. Most analytics tools can generate customized posting time recommendations based on when your specific followers are most active.
Content Format Correlation
Correlate content format (threads, images, video, polls, text posts) with follower acquisition data. You may find that threads consistently drive the most new follows while image posts drive higher engagement from existing followers. This insight allows you to use different formats intentionally for different goals.
Follower Analytics Benchmark Comparison
| Metric | Low Performance | Average | Strong Performance | Elite |
|---|---|---|---|---|
| Monthly Follower Growth Rate | <0.2% | 0.5–1% | 1–3% | 3%+ |
| Follower Engagement Rate | <0.5% | 1–2% | 2–5% | 5%+ |
| 30-Day Retention Rate | <70% | 75–85% | 85–92% | 92%+ |
| Follower-to-Following Ratio | <0.5:1 | 1:1–2:1 | 5:1–20:1 | 20:1+ |
| Bot/Inactive Follower % | 30%+ | 15–25% | 8–15% | <8% |
Frequently Asked Questions About Twitter/X Follower Analytics
How do I see who unfollowed me on Twitter/X?
X doesn’t natively notify you of unfollows. Third-party tools like Unfollower Stats, Who Unfollowed Me, and several premium analytics platforms track unfollows over time. Note that some tools may violate X’s API terms of service; always check before using.
What is a good follower growth rate for Twitter/X?
For established accounts, 1–3% monthly growth is solid performance. New accounts in their first 6–12 months often grow faster if content is strong and discovery mechanisms (hashtags, replies, collaborations) are used effectively.
How can I tell if my followers are real?
Use a follower audit tool to check your follower list for quality signals: account age, posting activity, profile completeness, and engagement patterns. Industry benchmarks suggest that 10–20% of followers on most accounts are inactive or low-quality — this is normal and doesn’t indicate purchased followers.
Do follower counts matter for brand partnerships?
Yes, but less than engagement rate. Most brands evaluate both metrics together, along with audience demographic alignment. A creator with 15K engaged, niche-aligned followers often commands better rates than one with 150K mixed followers with low engagement.
How often should I check my follower analytics?
Weekly review of key metrics is sufficient for most creators. Monthly deep-dives — correlating follower growth with content performance and identifying trends — are where real strategic insights emerge.
Can I export my follower data from X?
X Premium provides some data export functionality. Third-party tools typically offer more comprehensive export options in CSV or JSON format, which can then be analyzed in Excel, Google Sheets, or business intelligence platforms.
Conclusion
Twitter/X follower analytics is not about vanity — it’s about understanding whether your content strategy is attracting and retaining the right people. The number of followers you have matters far less than who those followers are, whether they’re engaged, and whether they match the audience you’re trying to build. By combining native X analytics with third-party tools and building a habit of data-informed decision-making, you can transform your follower analytics from a scoreboard into a strategic compass.