Your Twitter/X analytics dashboard is one of the most powerful tools available to any account on the platform — and one of the most ignored. Most accounts glance at their follower count and move on. But buried inside X’s native analytics are insights that can fundamentally change how you post, what you post, and when you post. This guide covers every major metric, what it actually means, and how to turn data into growth.
Accessing Your Twitter/X Analytics
X Analytics (analytics.twitter.com) is free for all accounts, though Premium accounts get more detailed breakdowns. To access it: click your profile icon → Analytics. On mobile, access is more limited — desktop gives you the full picture.
The Dashboard Overview
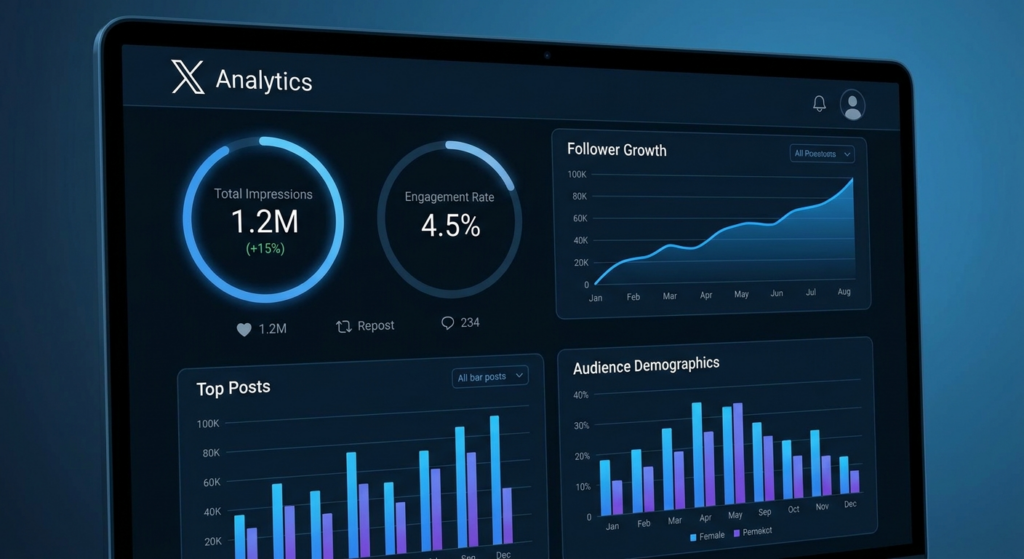
The main dashboard shows your last 28 days of activity: impressions, profile visits, mentions, and new followers. Below that, you see individual tweet performance and monthly summaries. This top-level view is useful for spotting trends, but the real insights come from drilling into individual posts and the audience dashboard.
Understanding Core Twitter/X Metrics
Before you can use analytics effectively, you need to understand what each metric actually measures — and what it doesn’t.
Impressions vs. Reach
Impressions count every time your post appears on a screen. If the same person sees your post 3 times, that’s 3 impressions. Reach counts unique accounts that saw your post. X’s native analytics show impressions, not reach. High impressions on a single post often indicate algorithmic amplification — X is showing it to new audiences beyond your followers.
Engagement Rate
Engagement rate = total engagements divided by impressions. “Engagements” on X include likes, reposts, replies, link clicks, profile clicks, media views, and hashtag clicks. A healthy engagement rate varies by account size — larger accounts typically see lower rates (1–3%) while smaller niche accounts often achieve 5–15%.
Link Clicks vs. Detail Expands
Link clicks measure how many people clicked a URL in your post. Detail expands measure how many tapped “more” to expand your post. High detail expands with low link clicks suggest compelling copy that doesn’t convert — your hook works but your CTA doesn’t. High link clicks relative to impressions signal exceptional offer-audience fit.
The 7 Metrics That Actually Matter for Growth
| Metric | Why It Matters | Target Benchmark | How to Improve |
|---|---|---|---|
| Impressions per post | Total reach of your content | Varies; track your own baseline | Post timing, hashtags, engagement velocity |
| Engagement rate | Content resonance with audience | 3–5% healthy; 7%+ excellent | Better hooks, more relevant content |
| Follower growth rate | Account health trajectory | 5–15% monthly | Viral posts, collaborations |
| Link click-through rate | Content-to-action conversion | 0.5–2% of impressions | Stronger CTAs, better landing pages |
| Reply rate | Community engagement quality | 10%+ of posts get replies | Ask questions, post opinions |
| Repost rate | Content shareability | 1–5% of likes | Post data, insights, strong takes |
| Profile visits to follows | Profile conversion rate | 5–15% conversion | Optimize bio, pin best content |
How to Use X Analytics to Improve Your Content Strategy
Data is only useful if it changes your behavior. Here’s how to translate metrics into actionable strategy.
The Monthly Audit
Every month, export your last 30 days of tweet performance data. Identify your top 5 posts by impressions and your top 5 by engagement rate. Look for patterns: What topics performed best? What formats (text, images, threads, polls)? What time of day? What length? Build your next month’s content plan around what worked.
Follower Growth Spikes
Your follower chart will have spikes — days where you gained significantly more followers than usual. Find those days in your tweet history. Which post went semi-viral? That format, topic, or angle is worth repeating. Most accounts have 2–3 “spike formulas” that consistently drive new followers.
The Underperforming Content Audit
Equally important: identify your worst-performing content. Posts with below-average impressions are being suppressed by the algorithm — they’re not resonating in the first few minutes of posting. Analyze why: Was the topic wrong? Was the hook weak? Did you post at the wrong time? Prune content types that consistently underperform.
Advanced Analytics: What Third-Party Tools Add
X’s native analytics are useful but limited. Third-party tools provide deeper analysis and competitive intelligence.
What Native Analytics Miss
Native X analytics don’t show you competitor performance, historical data beyond 90 days, optimal posting time analysis, or follower demographic breakdowns. They also don’t calculate engagement rate automatically — you have to do the math yourself.
Complementary Analytics Tools
Tools like Statweestics, Social Blade, and Followerwonk fill these gaps with richer data on follower quality, growth history, and comparative benchmarks. The combination of native X analytics (for content performance) and third-party tools (for competitive and audience analysis) gives the most complete picture.
Frequently Asked Questions
How do I access Twitter/X analytics?
Go to analytics.twitter.com or click your profile icon and select “Analytics” from the menu. Full desktop access is needed for comprehensive data. Some features require X Premium.
What is a good impression count on Twitter/X?
There’s no universal benchmark — it depends entirely on your follower count and niche. Track your own baseline over 30 days and aim to improve by 10–20% month over month through better content and posting strategy.
How often should I check my Twitter/X analytics?
A quick daily glance at post performance (5 minutes) and a deeper monthly review (30–60 minutes) is the right cadence for most accounts. Obsessing over real-time data leads to reactive posting decisions that usually backfire.
Does engagement rate matter more than follower count?
For most practical purposes, yes. A 1,000-follower account with a 10% engagement rate delivers more real-world impact than a 100,000-follower account with 0.1% engagement. Brands, sponsors, and partners increasingly understand this.
Why do my impressions fluctuate so much?
Impressions fluctuate because X’s algorithm distributes posts based on early engagement signals. A post that gets many likes and replies in the first 15–30 minutes gets amplified significantly. A post that doesn’t get early traction is shown to fewer people. Your audience’s activity level and the time you post drive most of this variance.
Can I download my Twitter/X analytics data?
Yes. In the analytics dashboard, look for the data export option (CSV). This allows you to download per-tweet performance data for the last 30 days, which you can analyze in Excel or Google Sheets.
Conclusion
Twitter/X analytics is a feedback loop. Post, measure, learn, adjust, repeat. Accounts that treat analytics as an integral part of their workflow grow faster, post better content, and avoid wasting time on formats and topics that don’t work for their specific audience. Spend 30 minutes per month in your analytics — it will save you hours of guesswork and accelerate your growth significantly.